Burwood
| 215 |
Registered Plans |
6,749 |
Lots |
This is part of the Burwood local government area
Other suburbs within this LGA
| # Lots |
Minimum |
Maximum |
Average |
| 6,749 |
2 |
330 |
31 |

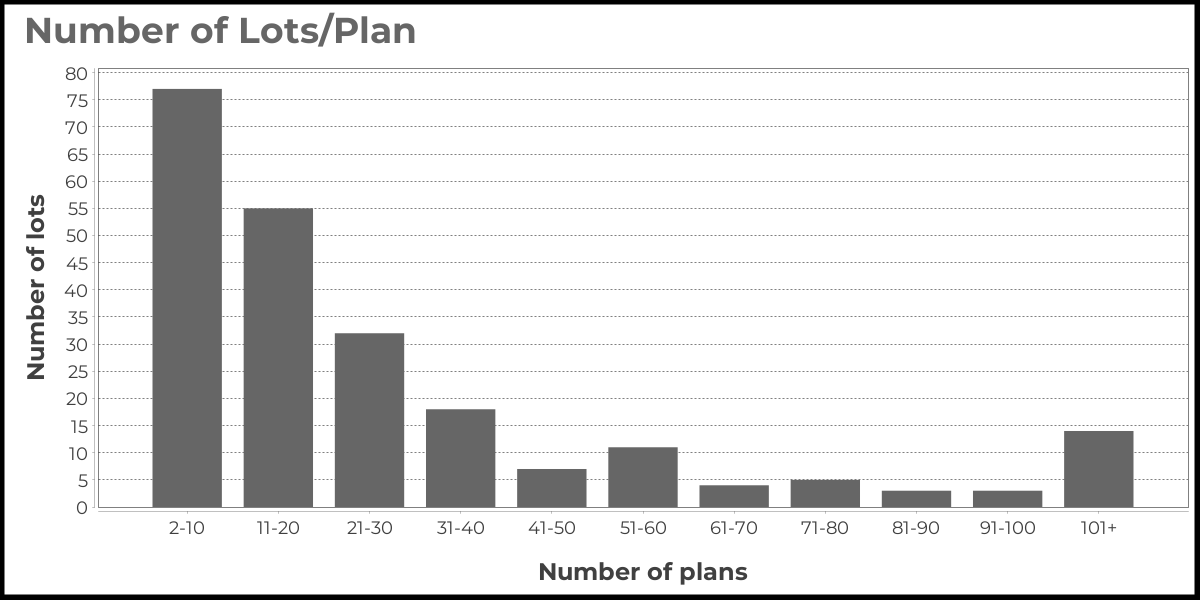
Distribution of number of lots
| 2-10 |
11-20 |
21-30 |
31-40 |
41-50 |
51-60 |
61-70 |
71-80 |
81-90 |
91-100 |
101+ |
| 70 |
50 |
30 |
18 |
7 |
11 |
4 |
5 |
3 |
3 |
14 |
| # plans |
Minimum age |
Maximum age |
Average age |
| 215 |
0 |
62 |
23 |

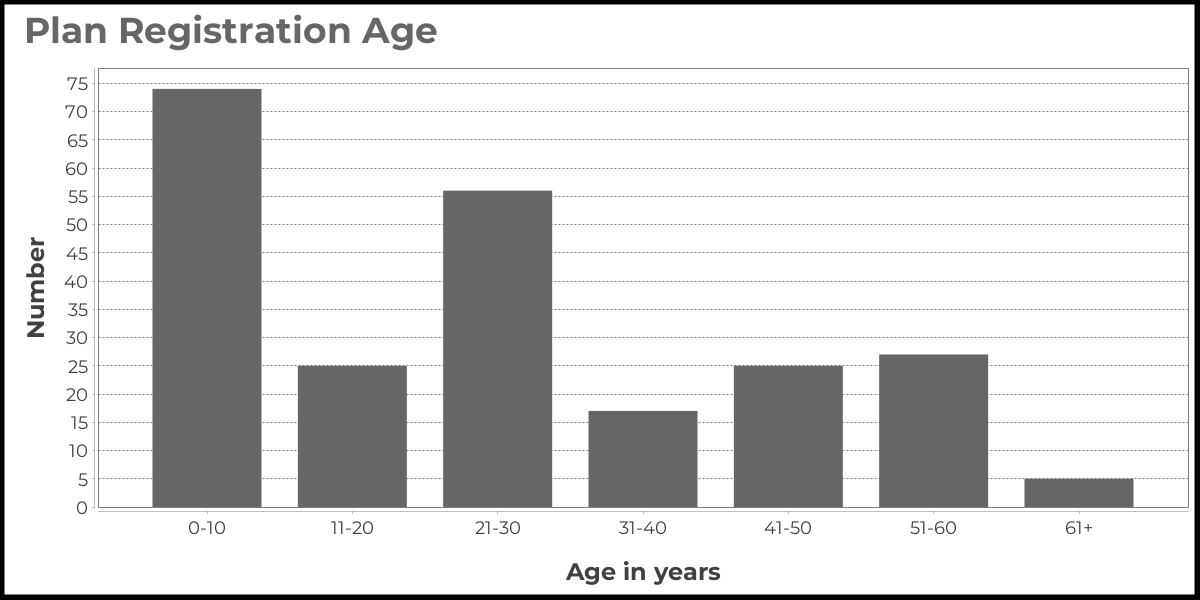
Distribution of plan registration age (in years)
| 0-10 |
11-20 |
21-30 |
31-40 |
41-50 |
51-60 |
61+ |
| 74 |
24 |
51 |
15 |
24 |
23 |
4 |
| # Known AGMs |
# Unknown AGMs |
Average per month |
| 215 |
28 |
17 |

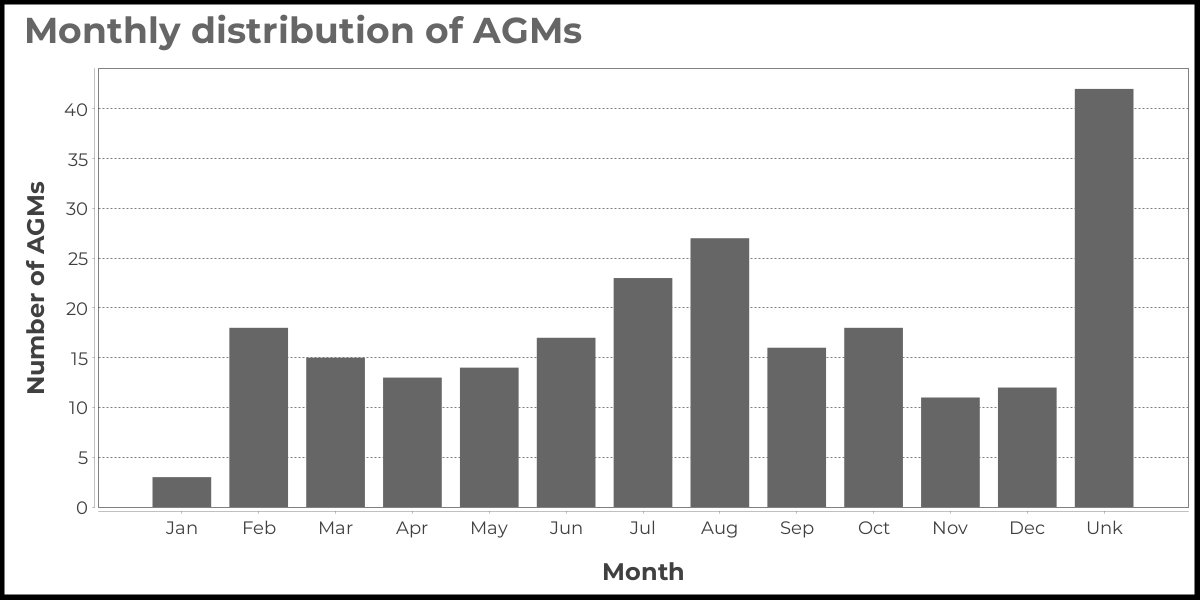
Distribution of AGMs per month
| Jan |
Feb |
Mar |
Apr |
May |
Jun |
Jul |
Aug |
Sep |
Oct |
Nov |
Dec |
Unk |
| 3 |
18 |
15 |
13 |
14 |
17 |
23 |
27 |
16 |
18 |
11 |
12 |
28 |


